Length ÷ width
Face length from hairline to chin, divided by cheekbone width. This is the strongest single cue for oblong versus round or square.
Your choice is stored only in this browser.
LightDarkSystemMeasurement guide
The report compares widths and lengths after aligning the eye line. Those ratios describe visible geometry. They do not rank faces, measure health, or reveal identity.
Face length from hairline to chin, divided by cheekbone width. This is the strongest single cue for oblong versus round or square.
Temple width divided by jaw-corner width. Higher values suggest a wider upper face; lower values suggest a wider jaw.
Cheekbone width divided by jaw width. A higher value suggests more taper through the lower face.
Jaw width divided by cheek width. A higher value suggests a broader, more square lower face.
How much the lower jaw narrows between the jaw corners and the chin. More taper supports heart and diamond readings.
Hairline to brow, brow to nose base, and nose base to chin. Differences are common and not a defect.

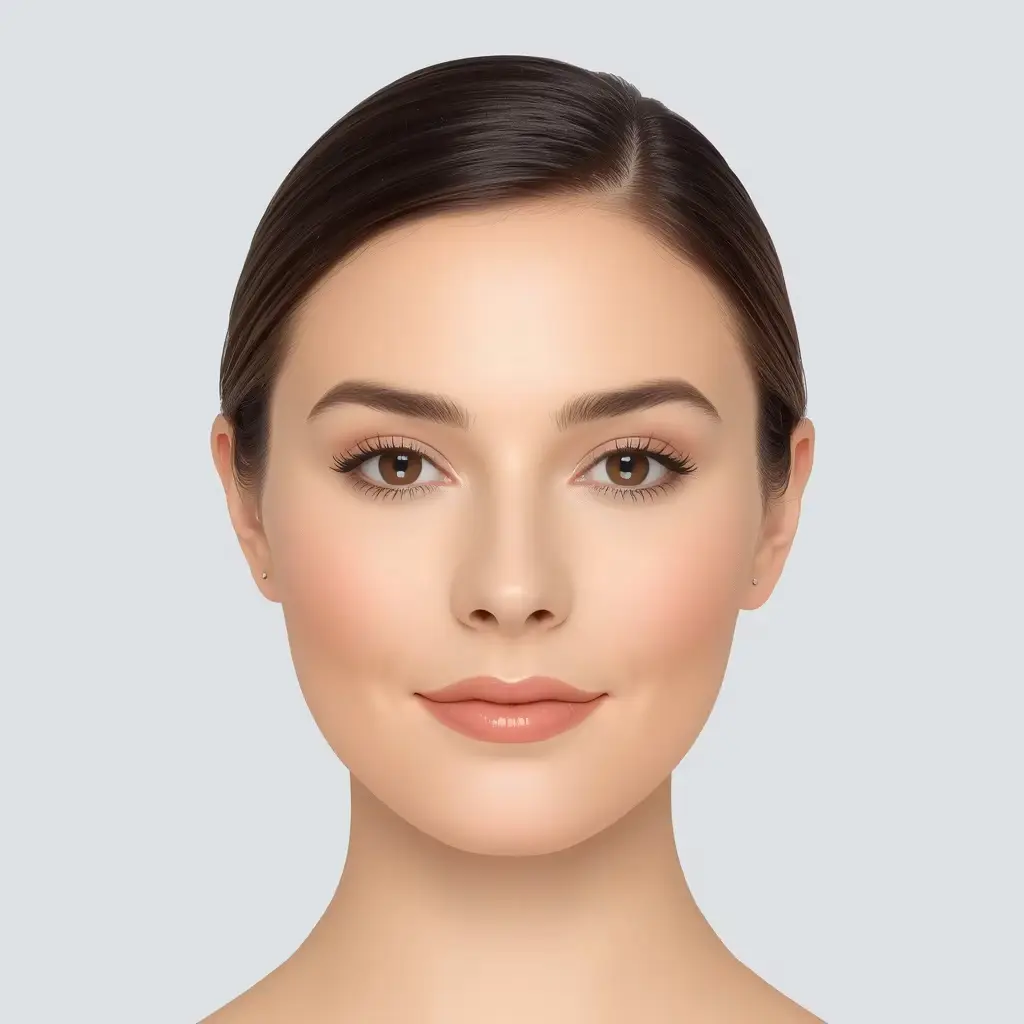
Ratios travel
Two portraits can share a length-to-width range and still look different because of hairline, cheek volume, jaw contour, and camera angle. That is why the report shows ratios and alternatives instead of a single verdict.
Use the numbers to compare your own photos over time. Do not use them to compare yourself with a reference portrait.
A note on “golden ratios”
You may see claims that a face is more attractive when certain proportions match the golden ratio. Those claims are popular, but they are not a reliable rule for individual faces, and they are not used to rank you here.
The report includes a few standard ratios because they are useful for comparing your own measurements over time or across photos. It does not assign a beauty score. A ratio outside a “classic” range is not a flaw; it is simply a different proportion.
The same caution applies to symmetry. The symmetry index measures landmark consistency after alignment, not attractiveness or health. Most faces are asymmetric in small ways, and photos can exaggerate the difference.
A close-up photo makes every distance larger in pixels. The detector therefore divides by a reference width or length before comparing shapes. It also rotates the landmarks to align the outer eye corners, which reduces the effect of head tilt.
Normalization cannot fix a turned head, a low camera angle, lens distortion, or a cropped hairline. That is why the report includes a capture-quality score and warns when the pose or sharpness is likely to shift the result.
Treat each ratio as a direction, not a grade. If you want a more angular look, you might add structure at the shoulders or choose frames with a stronger line. If you want a softer look, you might choose curved frames or draped fabric. The measurement tells you where the contrast already sits; it does not tell you what to want.